PARABOLIC ADVANCE
A parabolic advance is a trend whose rate of growth keeps rising. Each base is shorter than the last, each leg out of a base is steeper, and the pivot lows trace a convex support arc. When price closes beneath that arc the structure is spent, and the unwind usually runs back to where the curve began.
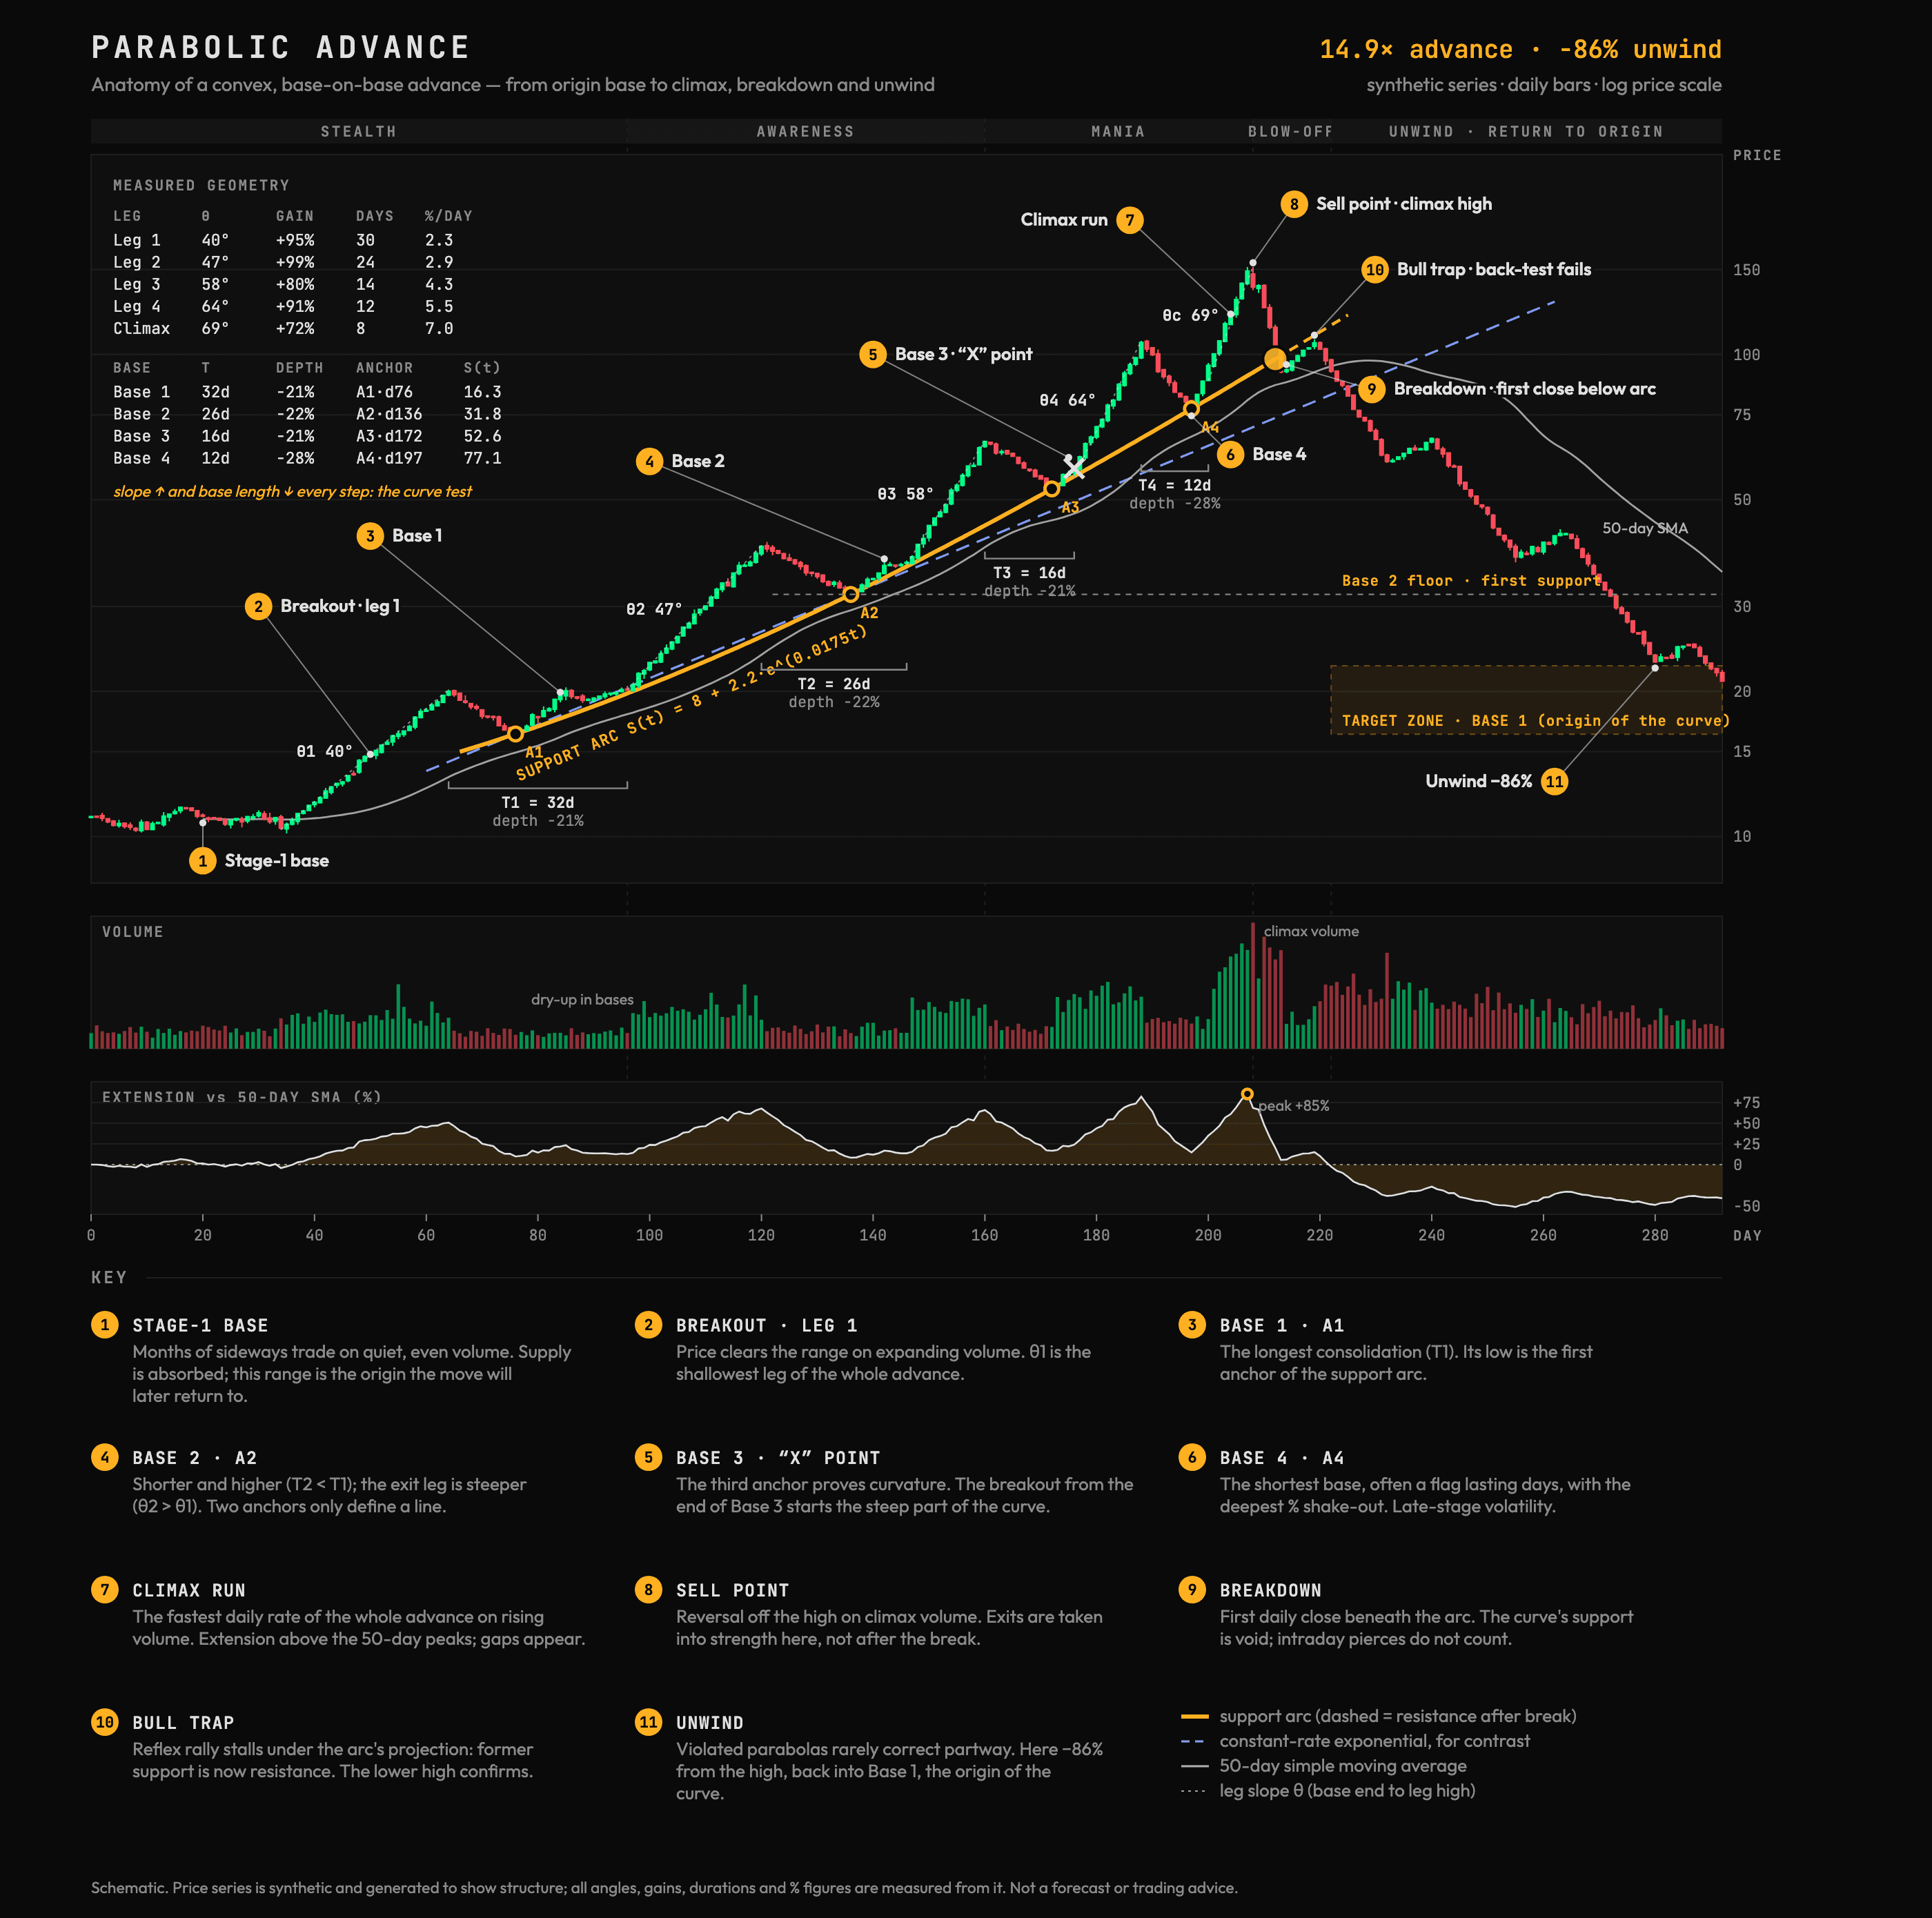
Phase reference
| # | Phase | Price structure | Volume | Sentiment |
|---|---|---|---|---|
| 1 | Stage-1 base | Flat range, months long. Defines the origin of the curve. | Low and even | Stealth |
| 2 | Breakout · leg 1 | Range high cleared; the shallowest leg (θ1). | Expands on the break | Stealth |
| 3 | Base 1 · A1 | Longest base (T1). Its low is the first arc anchor. | Dries up | Stealth → awareness |
| 4 | Base 2 · A2 | Shorter, higher, steeper exit (T2 < T1, θ2 > θ1). | Dries up, then expands | Awareness |
| 5 | Base 3 · “X” | Third anchor confirms curvature. The breakout from its end starts the steep part of the curve. | Expands sharply | Mania begins |
| 6 | Base 4 · A4 | Shortest base, deepest % shake-out. Price holds the arc. | Heavy both sides | Mania |
| 7 | Climax run | Steepest leg (θc) and the fastest daily rate, with gaps. | Rising into a record | Euphoria |
| 8 | Sell point | Reversal day off the high. | Record volume on the reversal | “New paradigm” |
| 9 | Breakdown | First daily close beneath the arc. | High, on red bars | Denial |
| 10 | Bull trap | Rally fails under the arc's projection and leaves a lower high. | Light | Return to normal? |
| 11 | Unwind | Retrace to Base 2, then Base 1: −86% here. | Elevated, then fades | Fear → capitulation |
Measured geometry
| Leg | Days | Length | Gain | Angle θ | Per day |
|---|---|---|---|---|---|
| Leg 1 | 34–64 | 30d | +95% | 40° | 2.3% |
| Leg 2 | 96–120 | 24d | +99% | 47° | 2.9% |
| Leg 3 | 146–160 | 14d | +80% | 58° | 4.3% |
| Leg 4 | 176–188 | 12d | +91% | 64° | 5.5% |
| Climax | 200–208 | 8d | +72% | 69° | 7% |
| Base | Days | Length T | Depth | Arc anchor | S(t) |
|---|---|---|---|---|---|
| Base 1 | 64–96 | 32d | −21% | A1 · day 76 | 16.3 |
| Base 2 | 120–146 | 26d | −22% | A2 · day 136 | 31.8 |
| Base 3 | 160–176 | 16d | −21% | A3 · day 172 | 52.6 |
| Base 4 | 188–200 | 12d | −28% | A4 · day 197 | 77.1 |
The test for a true parabola is the ordering: angle and compounded daily rate rise from leg to leg while base length falls. A straight line on a log chart is a constant growth rate, drawn as the dashed blue reference. A parabolic advance pulls away above it. Leg angles are screen angles on this chart, so read them as an ordering, not a threshold.
Is it really parabolic? Five checks
- 01Three anchors, not two. Two base lows only define a line. Draw the arc once a third base low (A3) sits on it without breaking it.
- 02Convex on a log scale. On a linear chart any steady exponential trend looks curved. Switch to log: if the trend turns straight, it is a channel, not a parabola.
- 03Bases compress. T1 > T2 > T3 > T4. Three or four bases is typical. A base that runs longer than the one before is the trend slowing.
- 04Legs steepen. Angle and compounded daily rate rise every leg. The leg out of the last base is the steepest of the move.
- 05Volume confirms. Volume expands on legs, dries up in bases, and sets its record during the climax or on the reversal day.
Breakdown protocol
- 01Plan the exit before the break. The sell point is the climax: record volume, peak extension, gaps, a reversal day off the high. Selling into strength happens there.
- 02Trigger. The first daily close below the arc. An intraday pierce that closes back above it does not count.
- 03Confirmation. A rally that stalls under the arc's projection and leaves a lower high, or a close below the Base 4 low.
- 04Targets. The Base 2 floor first, then the Base 1 range at the origin of the curve. Peter Brandt has noted that Bitcoin's broken parabolas corrected roughly 75–80% or more.
- 05Invalidation. Price reclaims the arc on a closing basis and makes a new high. Redraw a shallower arc through the new lows.
Sources
- Capital.com: Blow-off top pattern ↗
- Tapeboard: What is a blow-off top ↗
- Bitcoinist: Peter Brandt on a new parabolic advance ↗
- The Crypto Basic: Brandt on a 75% crash after a parabola break ↗
- Real Vision: Preparing for a parabolic advance ↗
- Passant Gardant: Final stage of a bubble (Rodrigue's stages) ↗
Most of the Brandt figures come from secondary news summaries of his posts. Educational reference only, not trading advice.